Low level measurements with Partector 2 & Pro
The Partector 2 & Partector 2 Pro are based on the measurement of tiny electrical currents with sensitive electrometers. Electrometers always have some noise, so when measuring very low particle concentrations, the accuracy of the measurements decreases. On this page we explain the limitations of our devices, and also how to make the most of your instrument if you want to measure low concentrations. As a general rule of thumb, particle concentrations below about 1000 pt/cm3 require more consideration due to noise. Such concentrations are rare in urban environments, but are typical for measurements in remote environments, where the Partector 2 is being used by some of our customers (e.g. Antarctica, the arctic region, balloon- or UAV-based measurements at higher altitudes).
Understanding noise
Noise is a random disturbance of a measurement signal. The Partector 2 measures signal amplitudes generated by charged aerosol particles. Due to electrometer noise, these amplitudes can never be zero, even if the Partector 2 is measuring HEPA-filtered air with no particles in it. These nonzero noise amplitudes result in a lower limit of detection or "noise floor", i.e. the device cannot measure e.g. 1 pt/cm3, because a typical detected concentration due to noise would be something like 100 pt/cm3 (depending on settings, see below). One important characteristic of noise is that it can be reduced by averaging. The general rule is that if you average over N values, the noise will be reduced by a factor √N.
Therefore, if you want to make measurements at low particle concentrations, you can at least theoretically reduce
the noise to arbitrarily low levels by using longer averaging times. However, this will obviously limit the
time resolution of the measurement, and there is also a point where further averaging no longer helps due to nonrandom
noise. The Partector 2 offers different internal averaging times ("timebase" in the menu): 2, 4, 8, 16, 32 and (only in
newer firmware versions) 64 seconds.
If you want to make measurements at low concentrations, you should choose a longer averaging time on the instrument itself.
Note that you could also average the output of the device running at shorter averaging time, but this would not achieve
the desired result, as the output of the device at shorter averaging times is more affected by the noise and will produce
a higher noise floor that will not disappear even when averaging the device output later.
Since the signal amplitude on the second electrometer stage is always lower than on the first stage, the ratio of signal to
noise on the second electrometer stage is usually the limiting factor in low concentration measurements with the Partector 2.
Optimal settings
For "normal" particle concentrations, we recommend a timebase of 4s for both the Partector 2 standard and the Partector 2 pro, but if you have low concentrations then longer integration times can be beneficial - obviously only if you don't need the higher time resolution in your data analysis. For the Partector 2 pro specifically, you should be aware of one of its limitations: it will produce incorrect results if the size distribution changes significantly over the time of one scan. If you use a timebase of 64s, the full scan will take a bit more than 4 minutes. If you are operating the device in a remote environment, chances are that nothing much changes in that time, but in urban environments the size distribution may change drastically in a few minutes; therefore we do not recommend using long integration times with the Partector 2 pro unless you really measure low concentrations. In the example of Jungfraujoch shown below, we operated the devices with a 32s integration time.
Since version 347, the Partector 2 firmware also includes internal filtering options to reduce noise further. The setting
can only be written via USB or a text file called "commands.txt" in the root of the SD card, which is read by the Partector 2 at
startup. If you are making lowlevel measurements, we recommend to set the filter value to 3 by sending the command "A0003!" via USB
or by creating a textfile called "commands.txt" with that single line of text inside. Place this textfile in the root directory of the
SD-card, and restart the Partector 2. It will parse the commands.txt file and execute this command just as if you had sent it by
USB. The value of this filter setting is visible in the
Partector 2 datafile header, in the line starting with "settings 3:" there is a value called antispike; e.g. "3 antispike" means that
this value is 3. Newer Partector 2 devices have this setting as factory default.
If you are running a firmware version below v379, we recommend to upgrade it for lowlevel measurements (contact us for upgrade
instructions).
If you are using a Partector 2 standard (or using the Partector 2 pro in standard mode), and you are measuring low concentrations, we recommend to turn off the "adaptive DV" setting. The particle size range will then be limited to 20-150nm, but this is good enough for most applications. With the adaptive DV setting, the Partector 2 would switch its internal deposition voltages to a lower value for very small particles and to a higher value for very large particles, to extend the measurement range for the diameter to 10-300nm. This works well as long as concentrations are high enough so that the signal amplitudes are well above the noise; however if both electrometer signals produce amplitudes that are close to the noise level, the signal amplitude on the second electrometer in particular will appear too high, and the Partector 2 firmware will switch the deposition voltage to its highest level and the measured diameter will increase to improbable values (see example below). When "adaptive DV" is turned off, this behavior still happens, but at least the diameter cannot go over 150nm.
While the Partector 2 pro can offer additional insight into the aerosol size distribution, it generally produces noisier measurements than the Partector 2 standard (or the pro version operated in standard mode). For very low concentrations it might therefore be beneficial to use the Partector 2 standard, or the pro version in standard mode, to get less noisy measurements.
High sensitivity version
If you know in advance that you will be measuring very low concentrations, we recommend that you order the high sensitivity version of the Partector 2. This version has electrometers with a higher gain, leading to a small improvement of the signal-to-noise ratio at low concentrations, at the price of lowering the upper limit of detection of the particle concentrations by a factor 3. For atmospheric measurements, the upper limit of detection of the high-sensitivity version is by far good enough.
Data analysis
As final thought: the most robust signal of the Partector 2 is always the LDSA value (because it is related to the first electrometer signal only, and thus less noisy than anything related to the second electrometer stage signal, which is lower). When analyzing noisy low-level data, it can be helpful to assume an average particle diameter and use the LDSA signal as a surrogate for particle number instead of the calculated particle number reported by the Partector 2. You can do this by looking at the ratio of particle number and LDSA in parts of your measurement where the concentrations are a bit higher, and then use that ratio to calculate a less noisy particle number for the low-concentration parts of your measurement.
Example 1a: laboratory Partector 2 Pro
In the following lab experiment, NaCl particles were generated by an evaporation-condensation process, and a chamber with a volume of about 1 m3 was filled with the particles. The average particle diameter was approximately 50nm. The particle size distribution and particle number were measured with reference instruments (SMPS; CPC) outside the chamber. Four high-sensitivity Partector 2 pro were running inside the chamber, running at 16s integration time. Over time, the concentration in the chamber decayed down to levels where the Partectors were getting to their lower limit of detection. The following graphs show how the results of the Partector 2 pro compared with the reference instruments during this experiment. Note that a slightly longer integration time (32 or 64s) would have been possible and might have given slightly better results. The results illustrate the general considerations above.
Particle size distributions
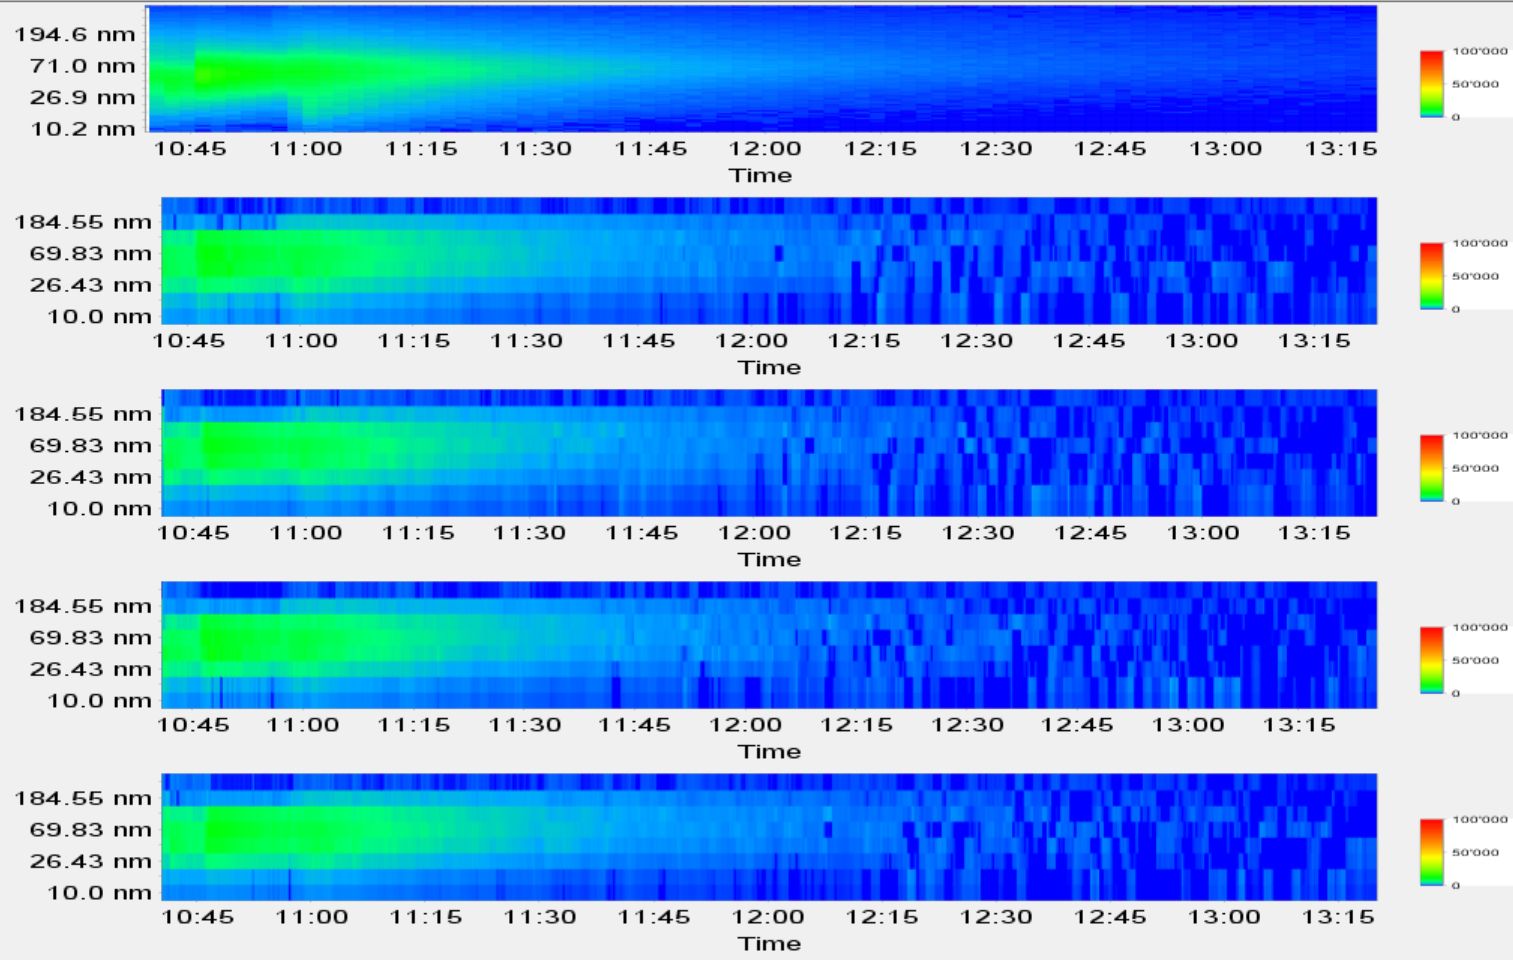
Top panel: SMPS. Four lower panels: the four Partector 2 pro. In the beginning of the experiment, the agreement is good,
but starting around 12:00 the values become noisier and towards the end it is obvious that the Partector 2 devices are measuring noise.
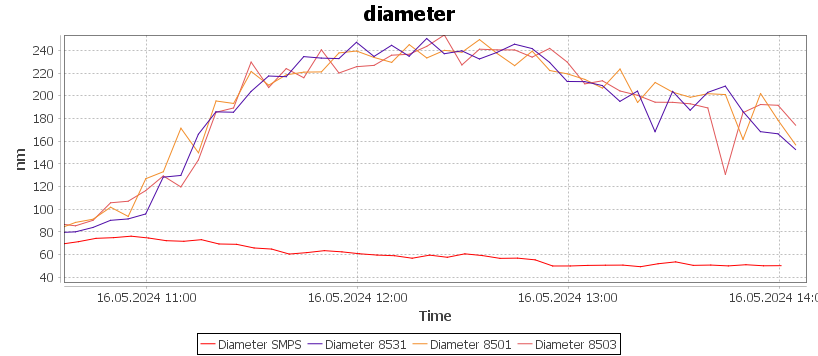
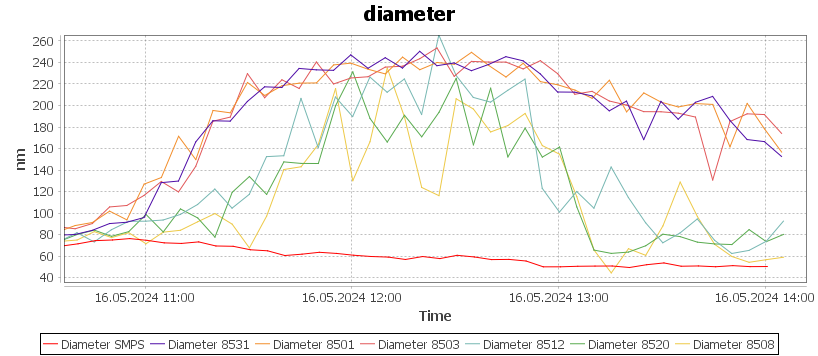
Particle diameter
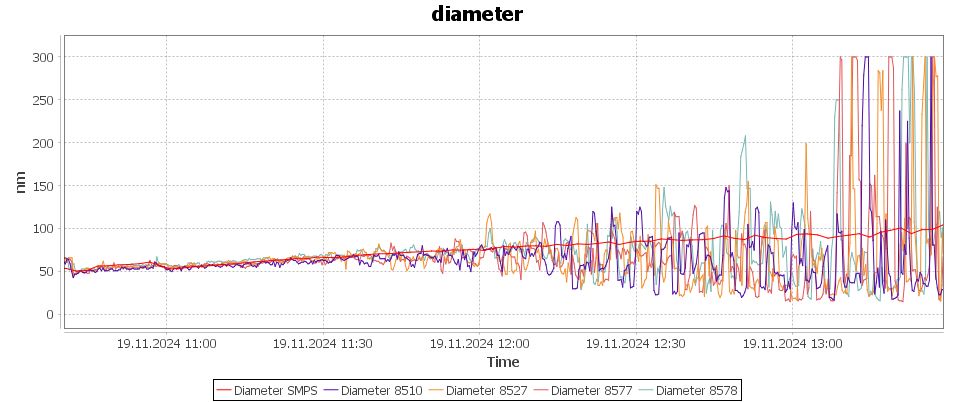
The following graph shows the reported particle diameter. The SMPS reference value is shown in red, starting at about
50nm, then growing slowly during the experiment; the other 4 colors are the 4 Partector 2 pro devices. While they agree
well in the beginning until about 12:00, the diameter reported gets a lot noisier until at the end it is more or less random noise.
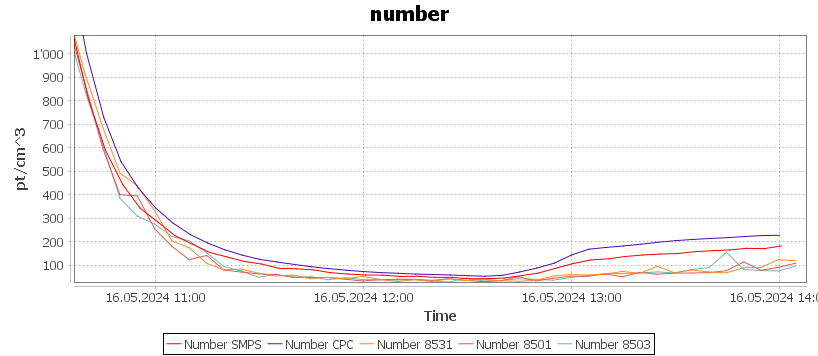
Particle number
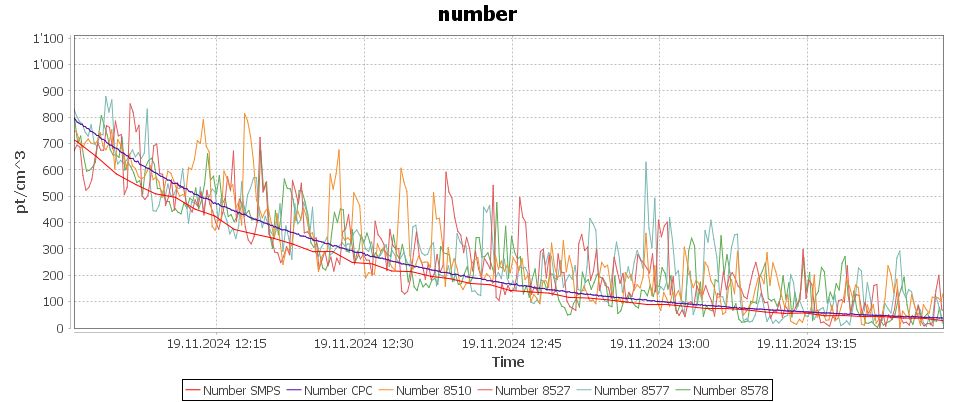
The following graph shows the reported particle concentrations, starting at 12:00 where the measurements of particle
size distribution and particle diameter start to get noisy. The SMPS reference value is again shown in red, the CPC in blue.
The other 4 colors are the 4 Partector 2 pro devices. At 12:00 agreement is still ok, but again the agreement gets
a lot worse towards the end. What is well visible here is that the reported particle number has a general noise of
approximately ±100 pt/cm3 over the whole duration, and in the end when the true particle concentration
has dropped to about 40 pt/cm3, the noise leads to an overestimation of particle number.
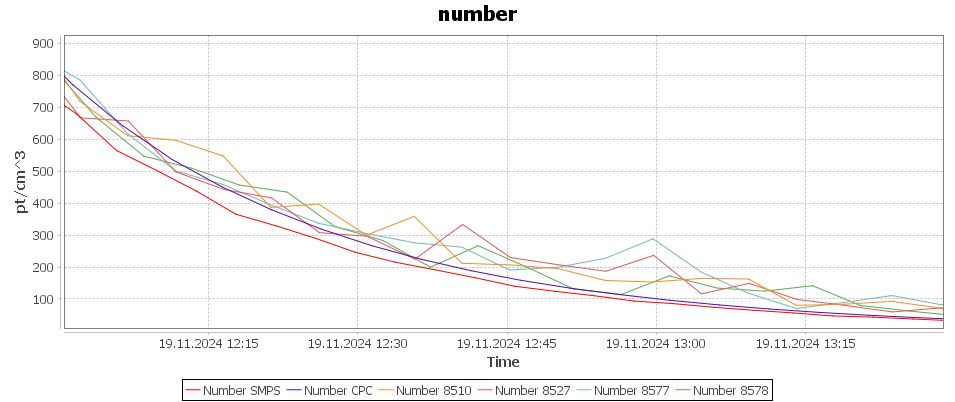
 The next graph shows what happens if the values reported by the Partector 2 are further averaged to 5-minute values.
A lot of the noise disappears, and the agreement with the reference is reasonable for a bit longer, but it is also clear
that from about 12:30 on, or below 300 pt/cm3 the Partector 2 pro number is an overestimation.
The next graph shows what happens if the values reported by the Partector 2 are further averaged to 5-minute values.
A lot of the noise disappears, and the agreement with the reference is reasonable for a bit longer, but it is also clear
that from about 12:30 on, or below 300 pt/cm3 the Partector 2 pro number is an overestimation.
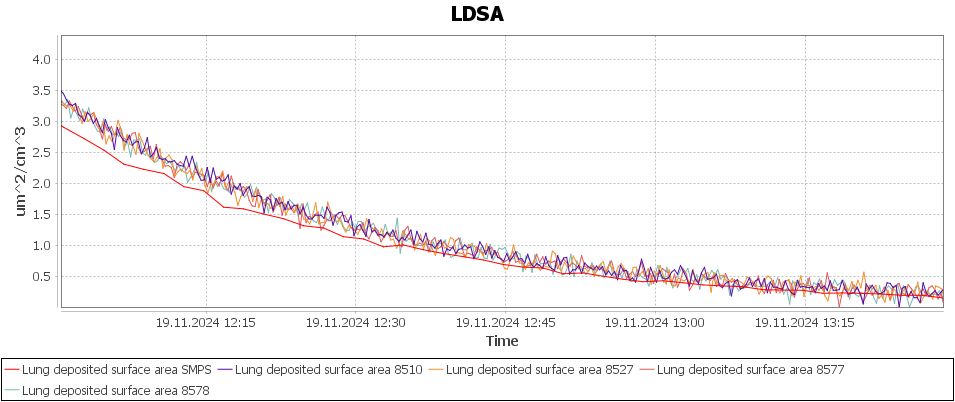
LDSA
The following graph shows the LDSA values reported by the Partector 2, and in red, the LDSA value calculated from the
SMPS size distribution. It is obvious that the LDSA value is far less noisy than the number concentration, as it doesn't
need the noisy diameter calculation.
 The next graph shows the same, but averaged over 5 minutes.
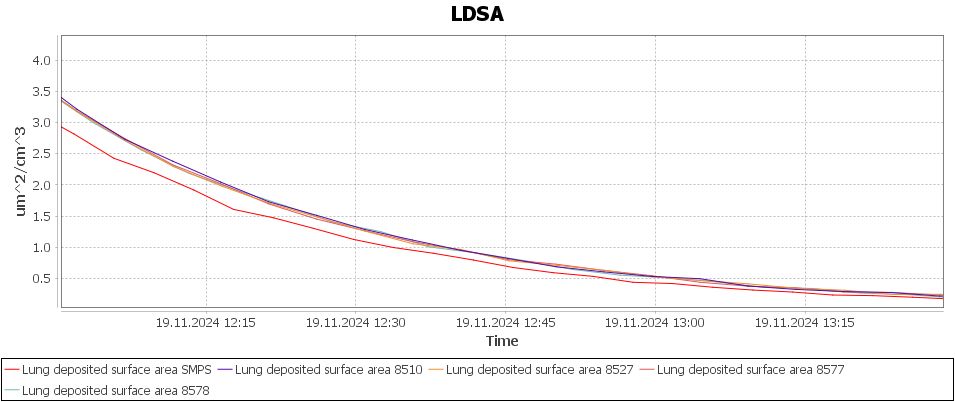 If one uses the number concentration reported by the CPC at 12:00 (see above) of 800 pt/cm3, and the LDSA values
reported by the Partectors at the same time of about 3.4 µm2/cm3, one can reason that at 13:30
with LDSA at 0.2µm2/cm3, the particle number concentration should be 0.2 / 3.4 * 800 pt/cm3
47 = pt/cm3; this is much closer to the CPC reference value (37 pt/cm3) than the average number reported
by the 4 Partector 2s.
If one uses the number concentration reported by the CPC at 12:00 (see above) of 800 pt/cm3, and the LDSA values
reported by the Partectors at the same time of about 3.4 µm2/cm3, one can reason that at 13:30
with LDSA at 0.2µm2/cm3, the particle number concentration should be 0.2 / 3.4 * 800 pt/cm3
47 = pt/cm3; this is much closer to the CPC reference value (37 pt/cm3) than the average number reported
by the 4 Partector 2s.
Example 1b: laboratory Partector 2 standard
The second lab experiment was performed with a similar setup but this time with 3 Partector 2 standard in the standard (non-high-sensitivity) version, running at 4 seconds integration time. It shows the typical behavior of the Partector 2 reporting too large diameters and correspondingly too low numbers at low concentrations.
Particle number
The following graph shows the reported particle concentrations, starting at about 10:30 where the particle number
concentration drops below 1000 pt/cm3. The SMPS reference value is again shown in red, the CPC in blue.
The other 3 colors are the 3 Partector 2 standard devices. The Partector 2 number would be noisy, so it is averaged over
5 minutes in this graph so one can see more clearly what is going on. In the beginning, from about 10:30 to 11:00, the
particle number of the Partector 2s agrees more or less with the SMPS, but once the concentration drops below about
300 pt/cm3, the Partector 2s start to underestimate the particle number concentration and it stays that way
until the end of the experiment even though concentrations rise a bit again towards the end.
Particle diameter
The reason the Partector 2s start to underestimate the particle number is that they overestimate the particle diameter
when the electrometer signals are dominated by noise, as described above. This can be clearly seen in the next graph,
where the particle diameter is shown, again averaged over 5 minutes for the Partector 2s, so that it can be seen more
clearly what is happening. In the beginning, it is still approximately correct, but then soon rises rapidly to unrealistic
values.
 In the final graph of this experiment, 3 more Partector 2s have been added to the diameter graph, these 3 instruments
were running at 32s integration time, and thus had lower noise. Therefore, the diameter stayed realistic for a longer
time, and also returns to a realistic value at the end of the experiment. Comparing with the particle number graph,
the results of the Partector 2s operating at 32s integration time are now approximately right down to about 100-150
pt/cm3. Note that although the data in the graph is averaged over 5 minutes for both the 4s and the 32s
integration time, so longer than both integration times and identical for both the 4s and 32s setting, the
32s setting produces a lower noise floor as described above.
In the final graph of this experiment, 3 more Partector 2s have been added to the diameter graph, these 3 instruments
were running at 32s integration time, and thus had lower noise. Therefore, the diameter stayed realistic for a longer
time, and also returns to a realistic value at the end of the experiment. Comparing with the particle number graph,
the results of the Partector 2s operating at 32s integration time are now approximately right down to about 100-150
pt/cm3. Note that although the data in the graph is averaged over 5 minutes for both the 4s and the 32s
integration time, so longer than both integration times and identical for both the 4s and 32s setting, the
32s setting produces a lower noise floor as described above.
Example 2: Measurements on Jungfraujoch
Two Partector 2 have been running for a bit more than a year (since autumn 2024) at the high alpine research station
Jungfraujoch at about
3500 meter above sea level. The research station is often in the free troposphere and thus sees very low particle concentrations.
There is an ACTRIS station located there too, with SMPS and CPC measurements of the particle size distribution and the
particle number concentration. The two Partector 2 are both high-sensitivity versions, one of them running as Partector 2 pro,
the other as Partector 2 standard, both using 32s integration time. While a full analysis of the data has not been performed yet, we can see that the
agreement with the reference instruments is at least sensible despite the very low concentrations. The following plots give
an impression of the results. The data shown is for 3 days in September 2024, just after installation.
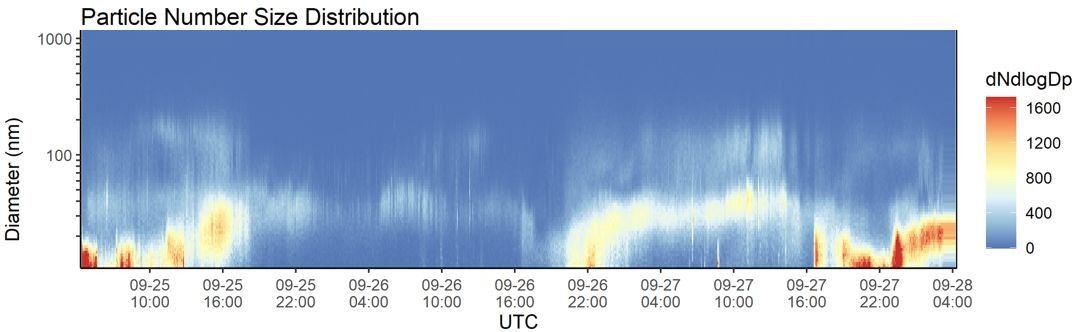
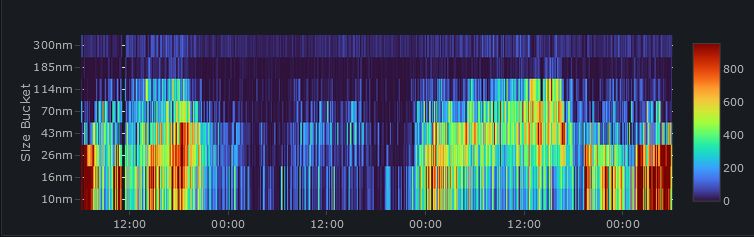
The first two plots show the particle size distribution measured by the reference instrument and for comparison with the Partector 2
pro. Obviously, the size distribution of the Partector 2 pro is noisy, but one can still nicely see the same features visible
in the reference (appearance of nucleation modes).
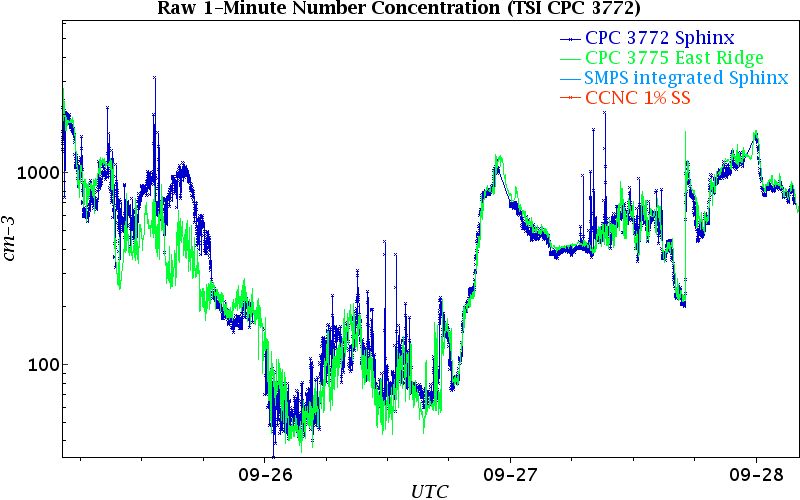
 The next two plots show the particle number concentration measured by the reference CPCs (the blue curve is the CPC
colocated with the two Partector 2 devices), and with the two Partector 2s. The noisier curve of the two Partector 2 graphs is the
P2 pro, the less noisy curve is the P2 standard. Small differences in concentrations can be explained by slightly different
lower cutoffs for the P2 and the CPC, a common issue when measuring UFPs. Nevertheless, it appears that concentrations even below
100 pt/cm3 could be measured reasonably well.
The next two plots show the particle number concentration measured by the reference CPCs (the blue curve is the CPC
colocated with the two Partector 2 devices), and with the two Partector 2s. The noisier curve of the two Partector 2 graphs is the
P2 pro, the less noisy curve is the P2 standard. Small differences in concentrations can be explained by slightly different
lower cutoffs for the P2 and the CPC, a common issue when measuring UFPs. Nevertheless, it appears that concentrations even below
100 pt/cm3 could be measured reasonably well.
 Images and data of reference instruments are courtesy of Paul Scherrer Institute (B. Brem, M. Gysel and C. Mohr)
Example 3: Measurements in Antarctica
In a similar setup, 2 Partector 2 devices have been measuring in Antarctica (at Neumayer station) since February 2025 (2 devices,
both in the high-sensitivity version, 32s integration times).
Again, the station is equipped with reference SMPS and CPC devices. The following plots of a few days shortly after
installation again give an idea of the performance.
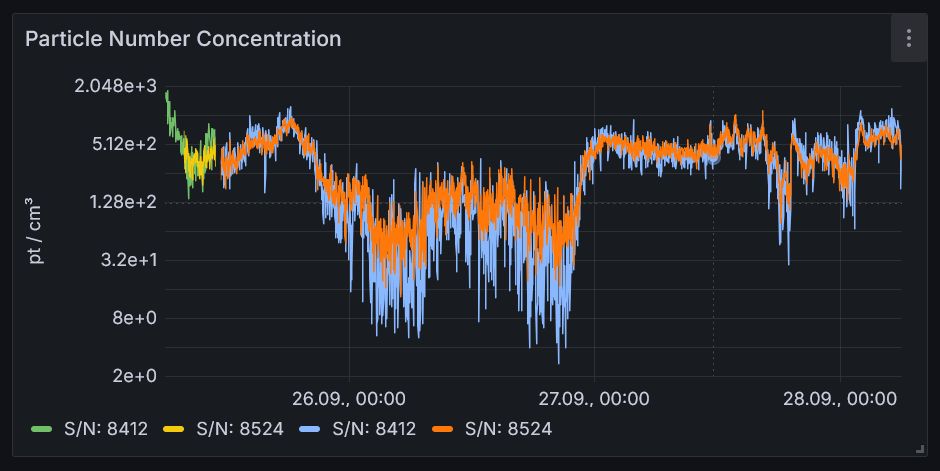
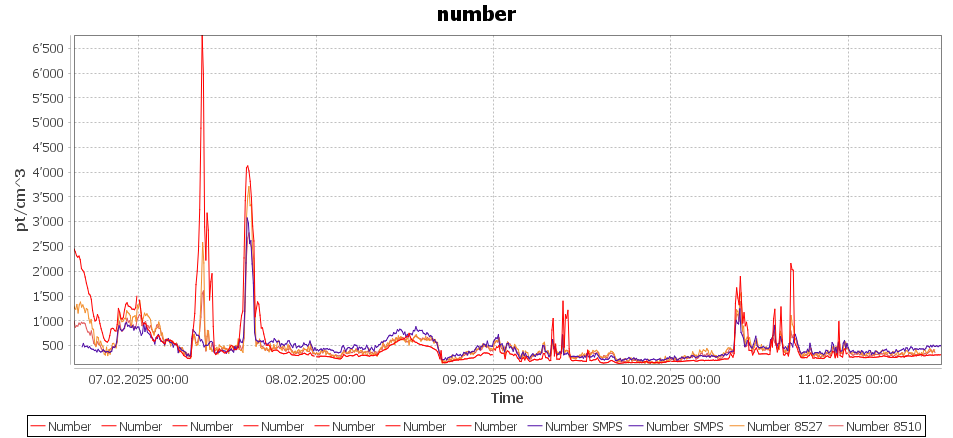
First, a plot of particle number concentrations for a few days. The red curve is the CPC, the blue curve the SMPS, the
two other plots are the 2 Partector 2s. P2 8510 is running in standard mode, 8527 in pro mode.
The particle number concentrations reported by the Partector 2s are somewhere in between CPC and SMPS, highlighting once
again the difficulty of comparing measurements of instruments with slightly different lower cutoff diameters.
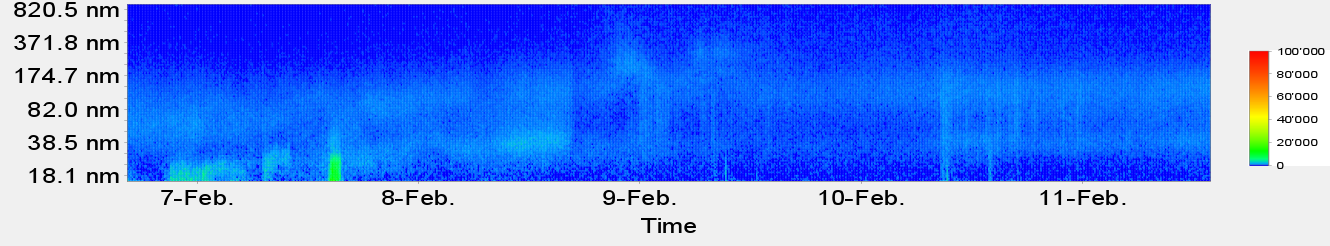
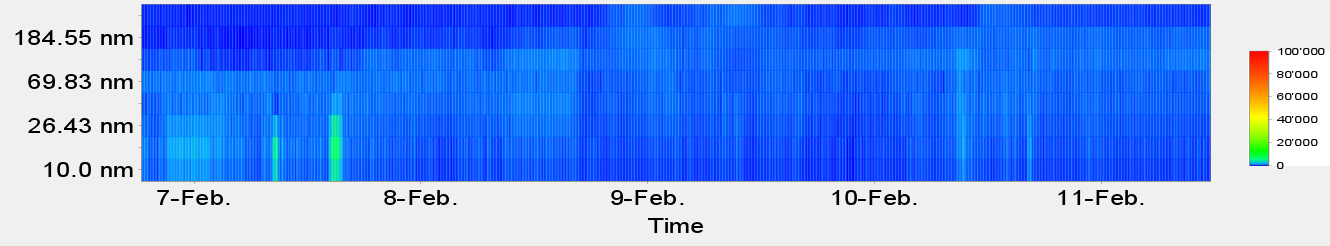
 The next two plots show the size distributions measured by the reference SMPS and the Partector 2 pro. Again
obviously the Partector 2 pro has a lower size resolution and a noisier signal overall, but seems to reasonably reproduce
the SMPS size distribution even at concentrations down to a few 100 pt/cm3.
The next two plots show the size distributions measured by the reference SMPS and the Partector 2 pro. Again
obviously the Partector 2 pro has a lower size resolution and a noisier signal overall, but seems to reasonably reproduce
the SMPS size distribution even at concentrations down to a few 100 pt/cm3.
 Images and data of reference instruments are courtesy of Alfred Wegener Institute (Z. Juranyi)